
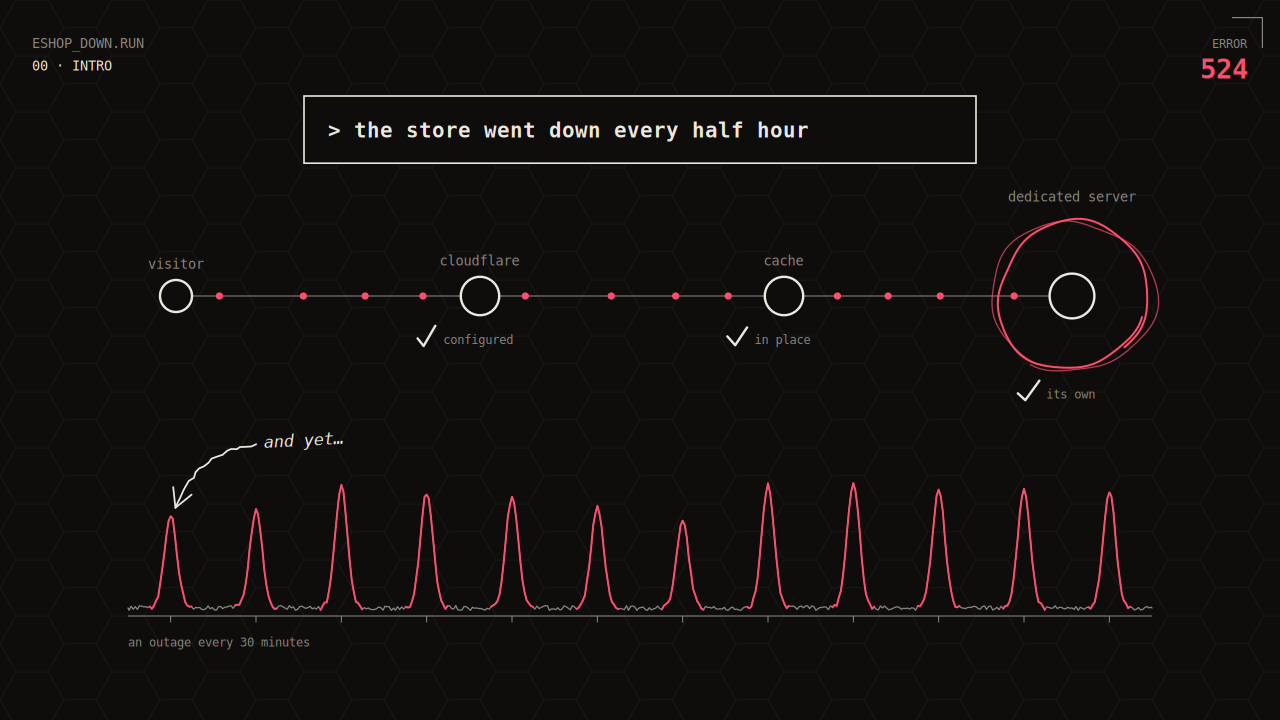
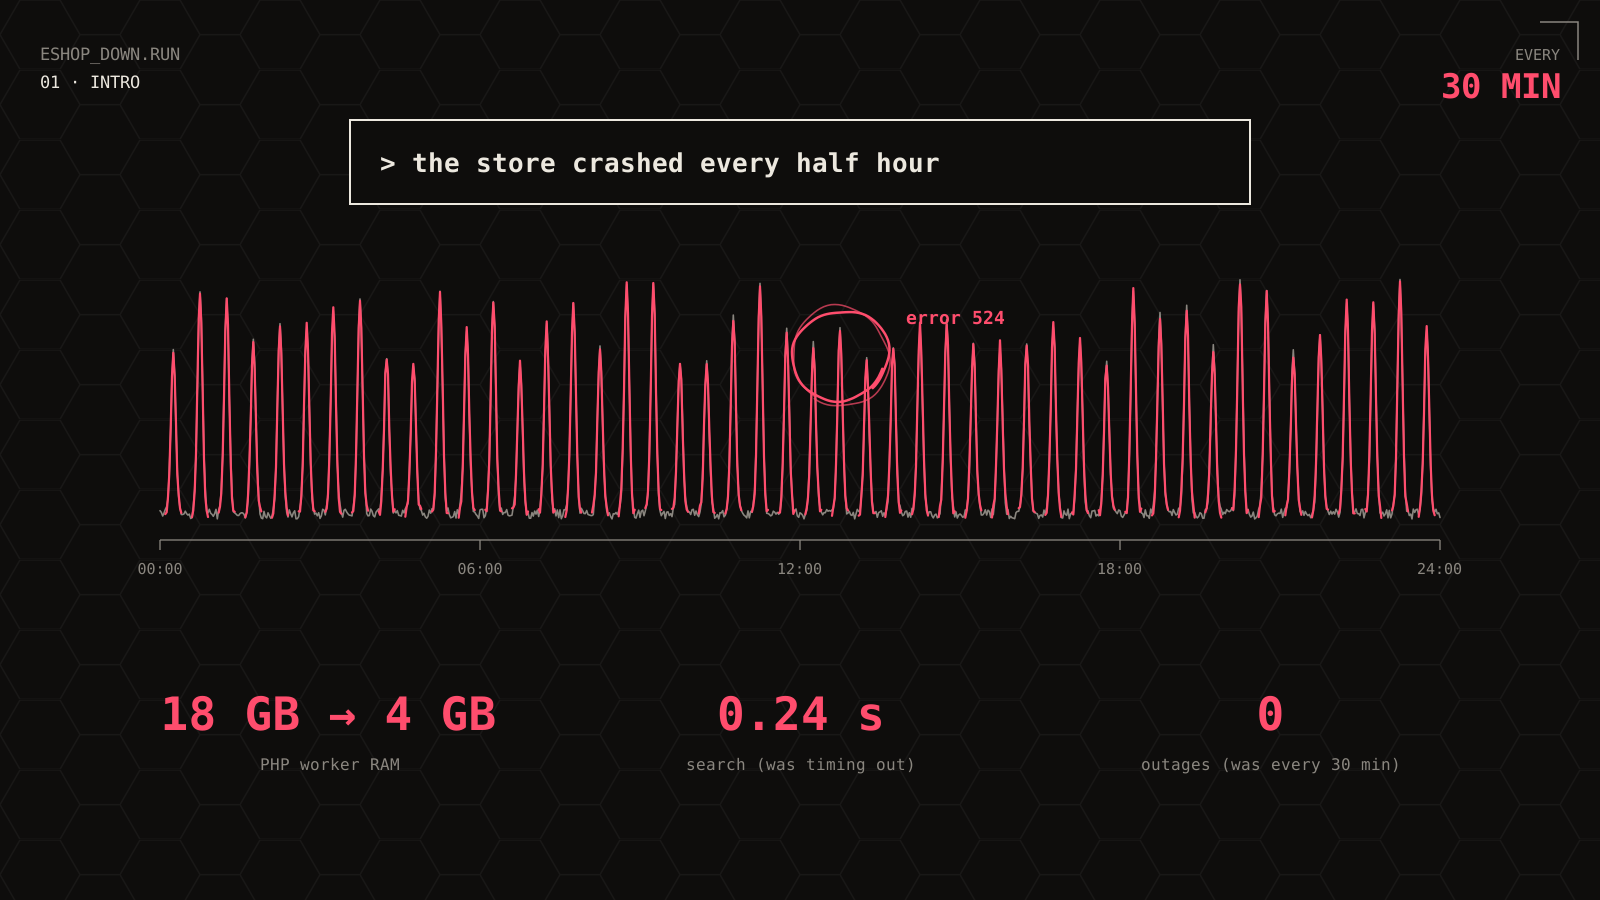
A WooCommerce store with roughly 10,000 products had everything usually recommended for a fast, stable site: its own dedicated server, caching in place and Cloudflare in front. It still went down every half hour. Visitors got a 524 error, and when the site did load, it loaded slowly. In analytics this showed up as a high bounce rate.
At the start we could not work out why at all. On paper everything was fine and there was no single bug to point at. The first two rounds of fixes did not help.
Starting point
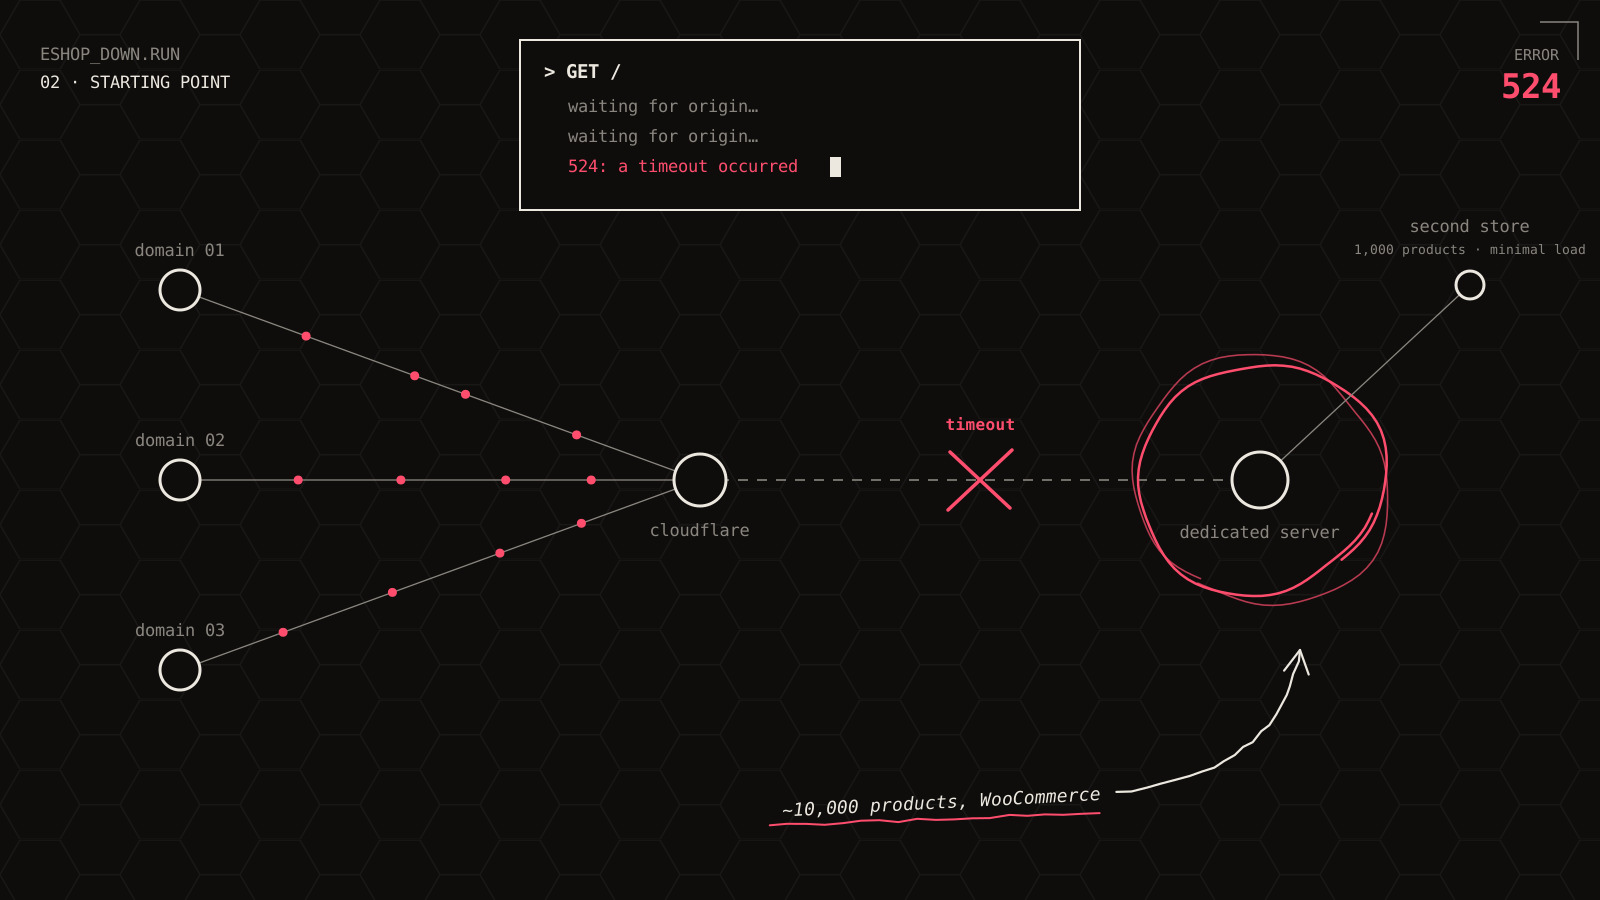
The store runs on WordPress and WooCommerce, has roughly 10,000 products and three language domains. It sits on a dedicated server shared with just one other store. That one has about 1,000 products and minimal load, so the noisy-neighbour explanation was ruled out straight away. The site had caching in place and traffic went through Cloudflare.
The outages came every half hour, regardless of traffic. At that moment the customer saw Cloudflare’s 524 error page. It means Cloudflare connected to the server but did not get a response in time. The site stayed unavailable for up to several minutes. The owner, trying to look into the admin, got a 503 from wp-admin, so he could not see what was happening on the server either.
Between outages the site loaded slowly. Together, the two showed up in analytics as a high bounce rate: people arrived, did not get a page and left.
The regularity of the outages was the first clue. A server that cannot keep up with customers goes down at peak times. This one went down even when almost nobody was on the site.
Investigation: from symptom to data
The road to the cause was not straight. First we fixed what seemed obvious, and the outages came back every time. Only then did we stop looking for slow code and start watching what was happening to the server.
Access logs: who visits the site
The first look went to the access logs. They were full of AI and SEO bot user agents, which is nothing unusual in itself. What was unusual was what they asked for: they kept requesting files that no longer existed on the site, such as gtm4wp/dist/js/….
Bots were the obvious suspect, so we went after them first.
First attempt: blocking bots in Cloudflare
The log also contained bot requests for URLs with the add_to_cart parameter. A cache cannot serve such a URL; every one goes to PHP and starts WooCommerce. So in Cloudflare we blocked all bot requests for add_to_cart URLs.
That was not enough, so we went further and blocked all unapproved bots.
Things improved, but only briefly. Within 24 hours everything was back and the site was going down just as before.
Second attempt: slow plugins
If it was not just the bots, the problem had to be in the application. We deployed New Relic for profiling and looked for bottlenecks, from WooCommerce core processes down to individual plugins.
We removed plugins that were not used at all, or barely used, and could be dropped. One plugin stood out as a real burden: the product filter (WooCommerce Product Filter), which put a fairly significant load on the product archive. We replaced it with our own solution built on an advanced cache index.
That did not help either. The outages continued.
PHP-FPM pool: what is happening to the server
After two failed rounds we changed direction. The next step was watching the PHP-FPM pool live, that is, the processes that handle PHP requests. We had the individual workers listed continuously with their memory (RSS) and CPU load.
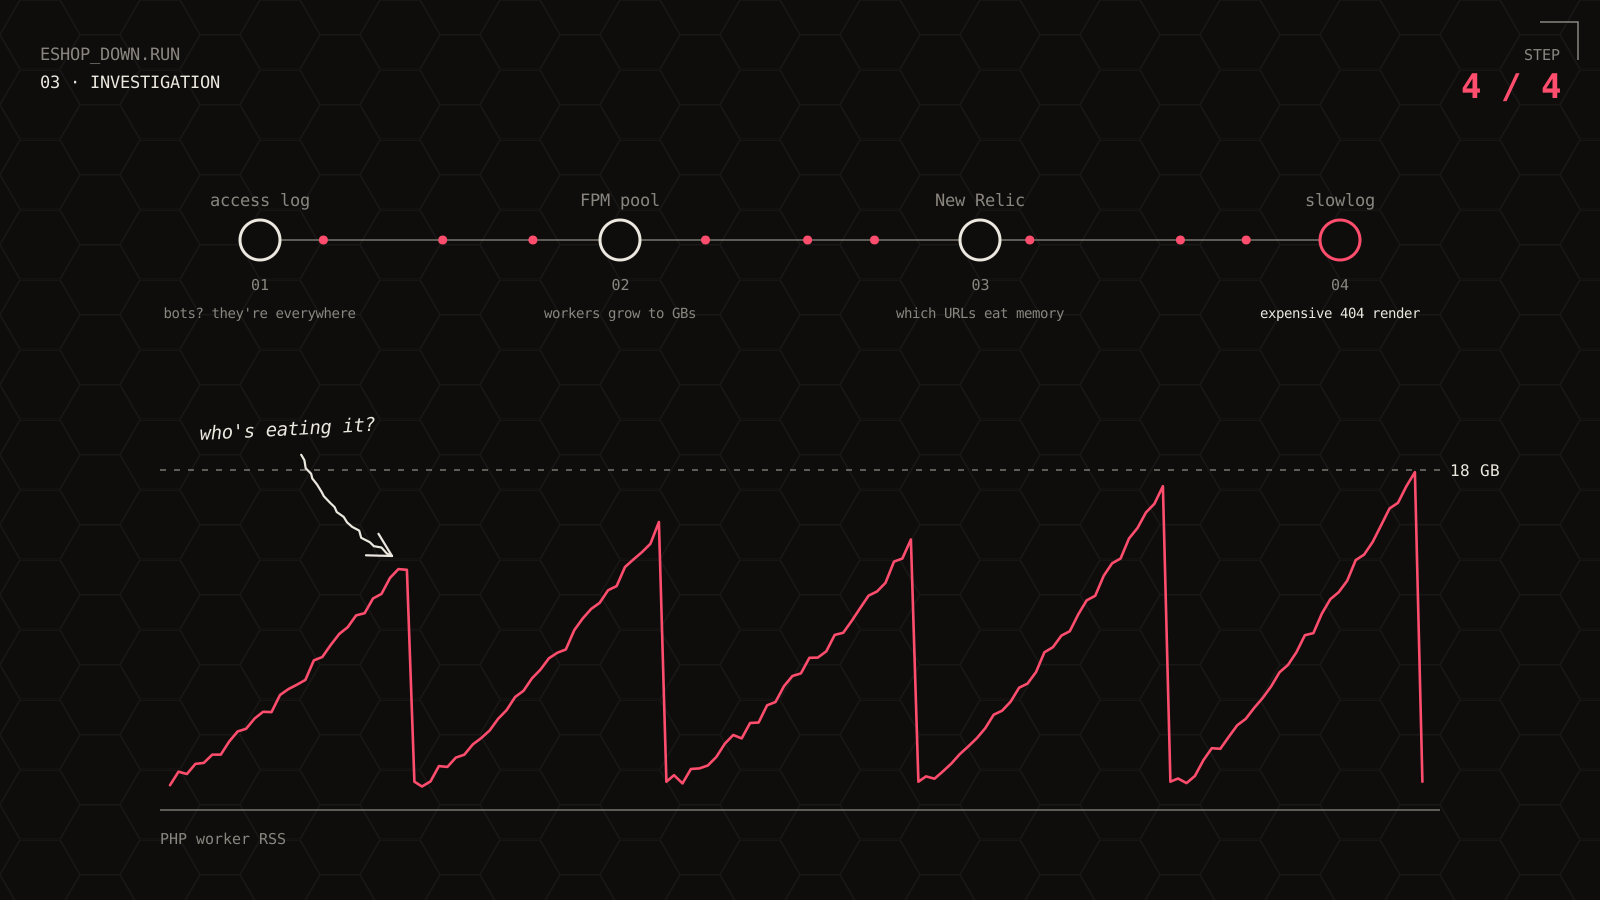
This was the first time something concrete showed up. The workers were not growing by megabytes but into gigabytes, and nothing stopped them. So we knew the server was running out of memory. We did not know what was using it.
New Relic: which requests eat the memory
New Relic was already in place. This time we asked it a different question: not what is slow, but what is using memory.
We put two data sets side by side. The memory of individual processes (ProcessSample) and the APM transactions, an overview of which URLs the server was handling at a given moment. Their correlation showed which URLs were using the memory.
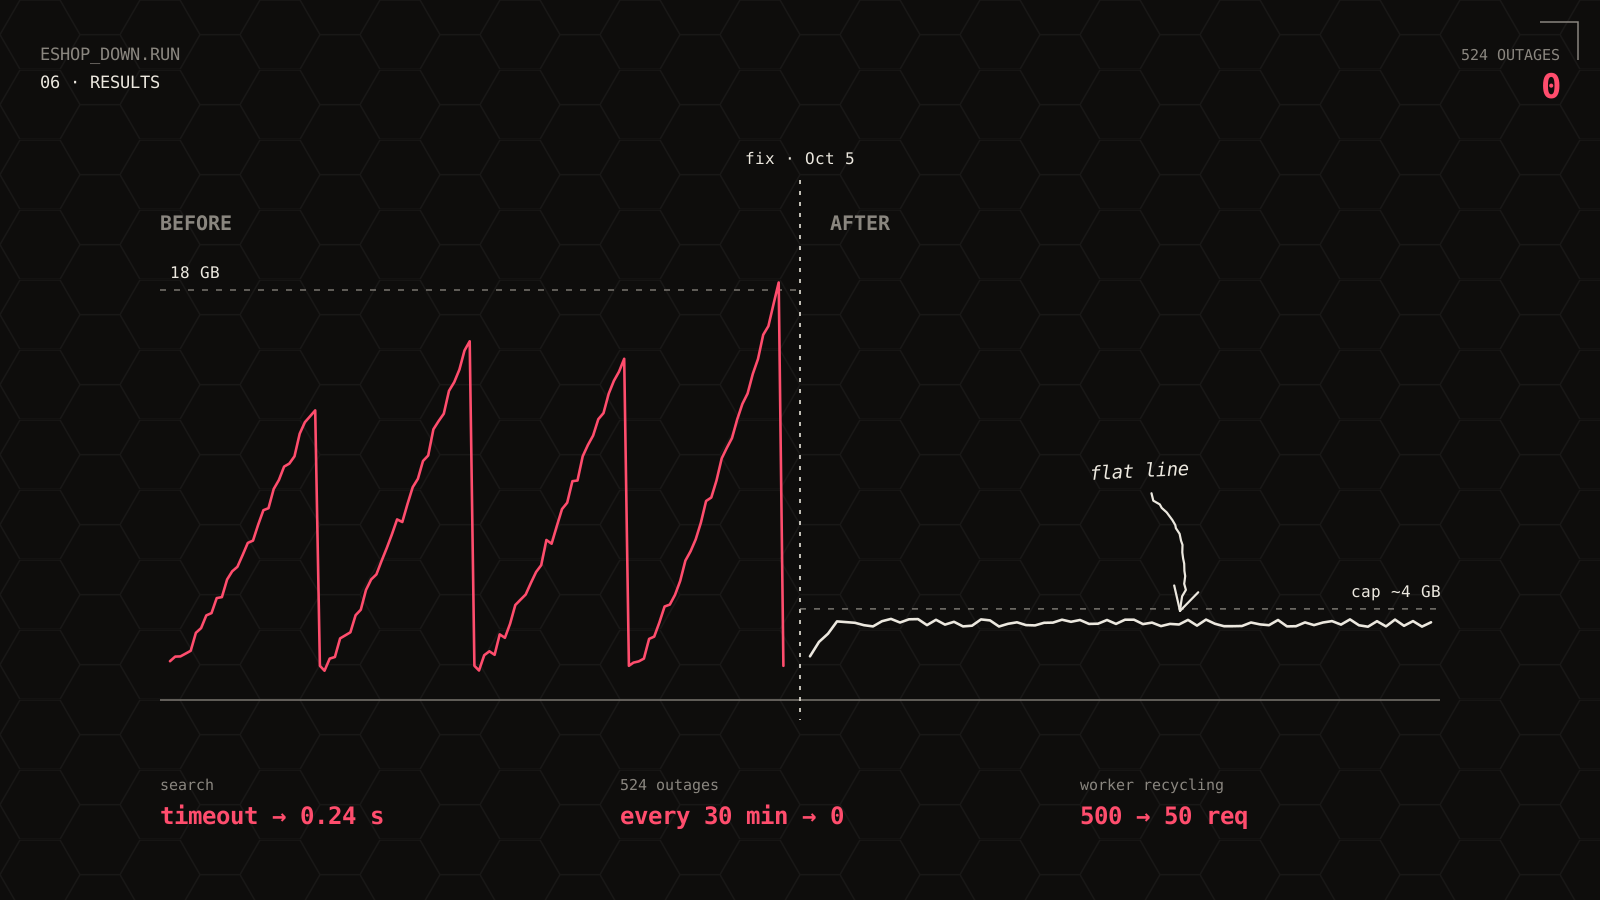
The worker memory graph had a sawtooth shape. Memory climbed to 13–18 GB, dropped and started climbing again.
Slowlog: what exactly PHP is doing
The last step was the PHP slowlog, which records the function PHP is in during slow requests. The stack trace pointed to a specific place, and it was neither the cart nor the checkout. It was the rendering of the 404 page, where the time went into Block Hooks and wp_kses.
The most expensive operation on the whole store was the answer “this page does not exist”.
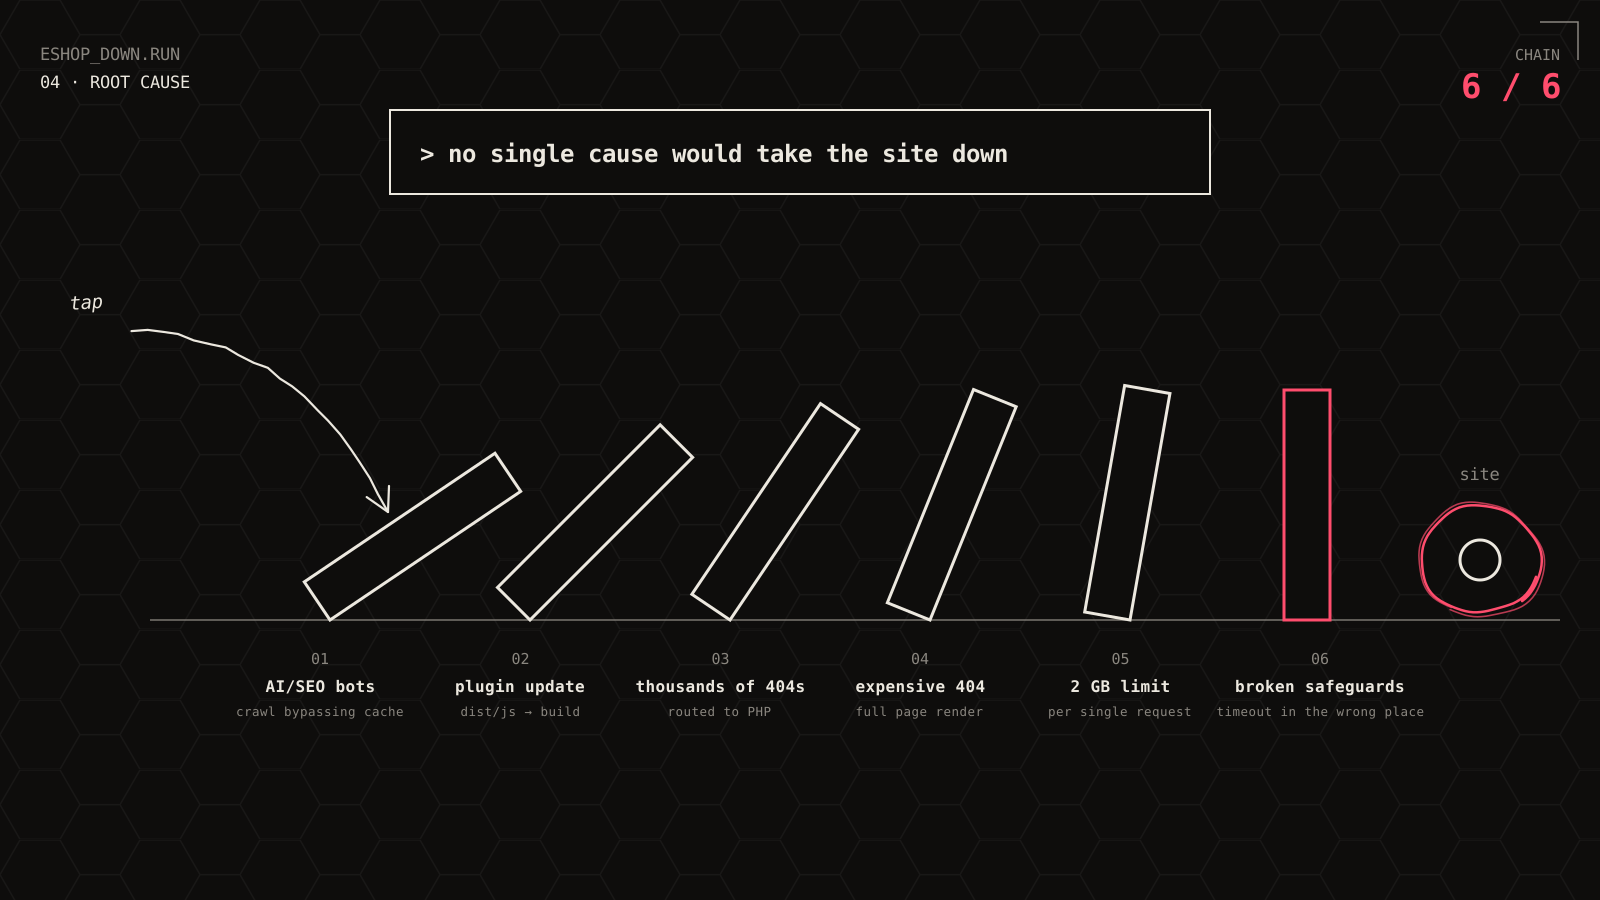
Root cause: a chain, not a single bug
Once we lined the findings up, a chain of six links emerged. None of them would have taken the site down on its own.
- AI and SEO bots. They crawl heavily and with no regard for the cache. On a site where everything else is fine, that is just extra traffic.
- A plugin update. During an update, a plugin moved its JavaScript folder from dist/js to build. Nothing changed for visitors; the pages linked to the new location. But the old URLs stayed in circulation and bots kept asking for them.
- Thousands of 404s. The web server did not handle requests for the vanished files itself. It did not find the file on disk, so it handed the request to WordPress, that is, to PHP.
- An expensive 404. For every such request WordPress rendered the whole 404 page with everything that comes with it: Block Hooks, sanitization, translations. Instead of an instant answer to a request for a single .js file, a full render ran every time.
- A 2 GB per-request limit. The PHP memory limit was set high, “to be on the safe side”. A single request was allowed to take up to 2 GB before PHP ended it.
- Broken safeguards. PHP-FPM has two safeguards for cases like this and both failed. The request time limit was written as php_admin_value[request_terminate_timeout], a place where it does not apply, and PHP-FPM silently ignored it. Worker recycling only kicked in after 500 requests, which was too late.
In practice it went like this: bots sent a wave of requests for the old files, each one triggered the expensive 404 render and the workers started to grow. The limit did not stop them, the timeout did not apply and recycling did not come in time. Worker memory climbed to 13–18 GB and Cloudflare returned 524.
Without the bots, nobody would have hit the expensive 404 at scale. Without the plugin update, the bots would have received existing files. With a sensible limit and a working timeout, the server would have coped with the wave of 404s.
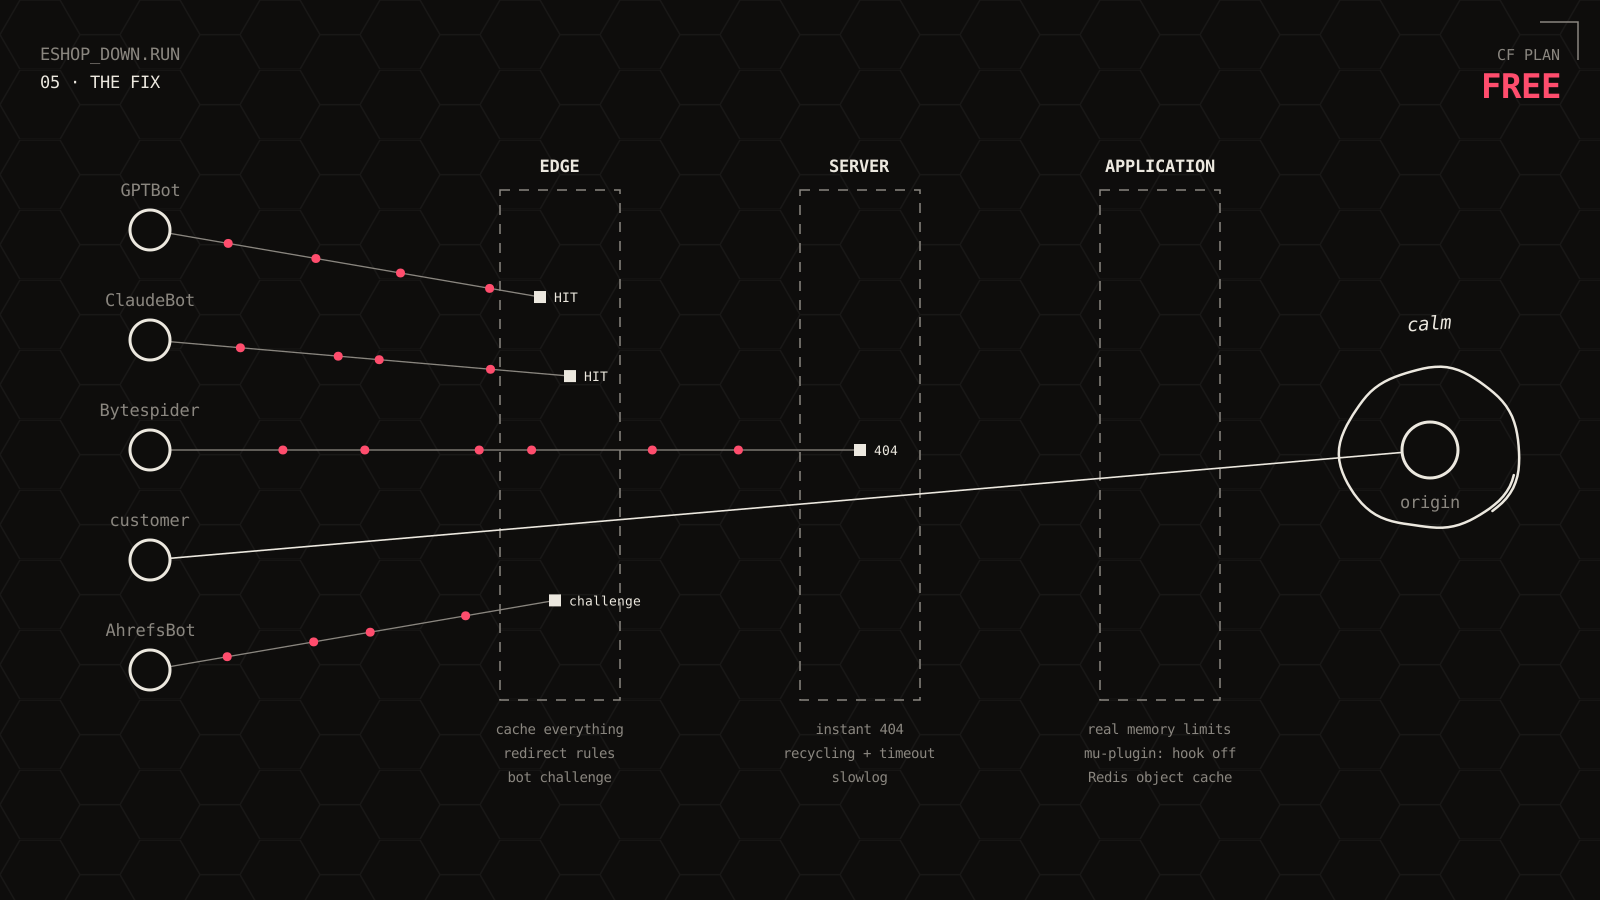
The fix in three layers
The chain could be broken at any link. We broke it in three places at once, so that one failed layer would not mean another outage. Everything on the Cloudflare side fit into the Free plan.
Edge (Cloudflare)
The first layer is there to catch as many requests as possible before they reach the server at all.
- Cache everything for anonymous HTML. A visitor who is not logged in gets the page from Cloudflare’s edge cache and the server never hears about the request.
- Redirect rules for the moved files. Anyone asking for an old URL is redirected to the file’s new location.
- A bot challenge on expensive URLs. A custom rule with Managed Challenge sits in front of addresses that are costly for the server to handle.
Server
The second layer deals with what gets through Cloudflare.
- An instant 404 for non-existent static files. A rule in .htaccess returns the 404 straight from the web server. Neither PHP nor WordPress starts for a missing file.
- Working worker safeguards. The time limit is written as a pool directive, where it actually applies. A worker is recycled after 50 requests instead of 500.
- Slowlog. It stays on, so the next slow request is visible right away.
Application
The third layer makes the requests that legitimately reach WordPress cheaper.
- Realistic memory limits. The limit matches what a request actually needs, not 2 GB.
- Disabling the expensive hook. A short mu-plugin turns off the hook that made rendering expensive.
- Redis object cache. Repeated database queries are served from memory.
Results
The outages stopped. Worker memory, which used to grow without limit up to 18 GB, stays under a cap of about 4 GB. Search, which used to end in a timeout, responds in 0.24 s.
| Metric | Before | After |
| PHP worker memory | 13–18 GB, unlimited growth | cap ~4 GB |
| Response for vanished files | full PHP render, tens of seconds under load | instant 404 without PHP |
| Search | timeouts | 0.24 s |
| 524 outages | every half hour | 0 |
| Worker recycling | after 500 requests | after 50 requests |
| Anonymous HTML | always PHP | from edge cache |
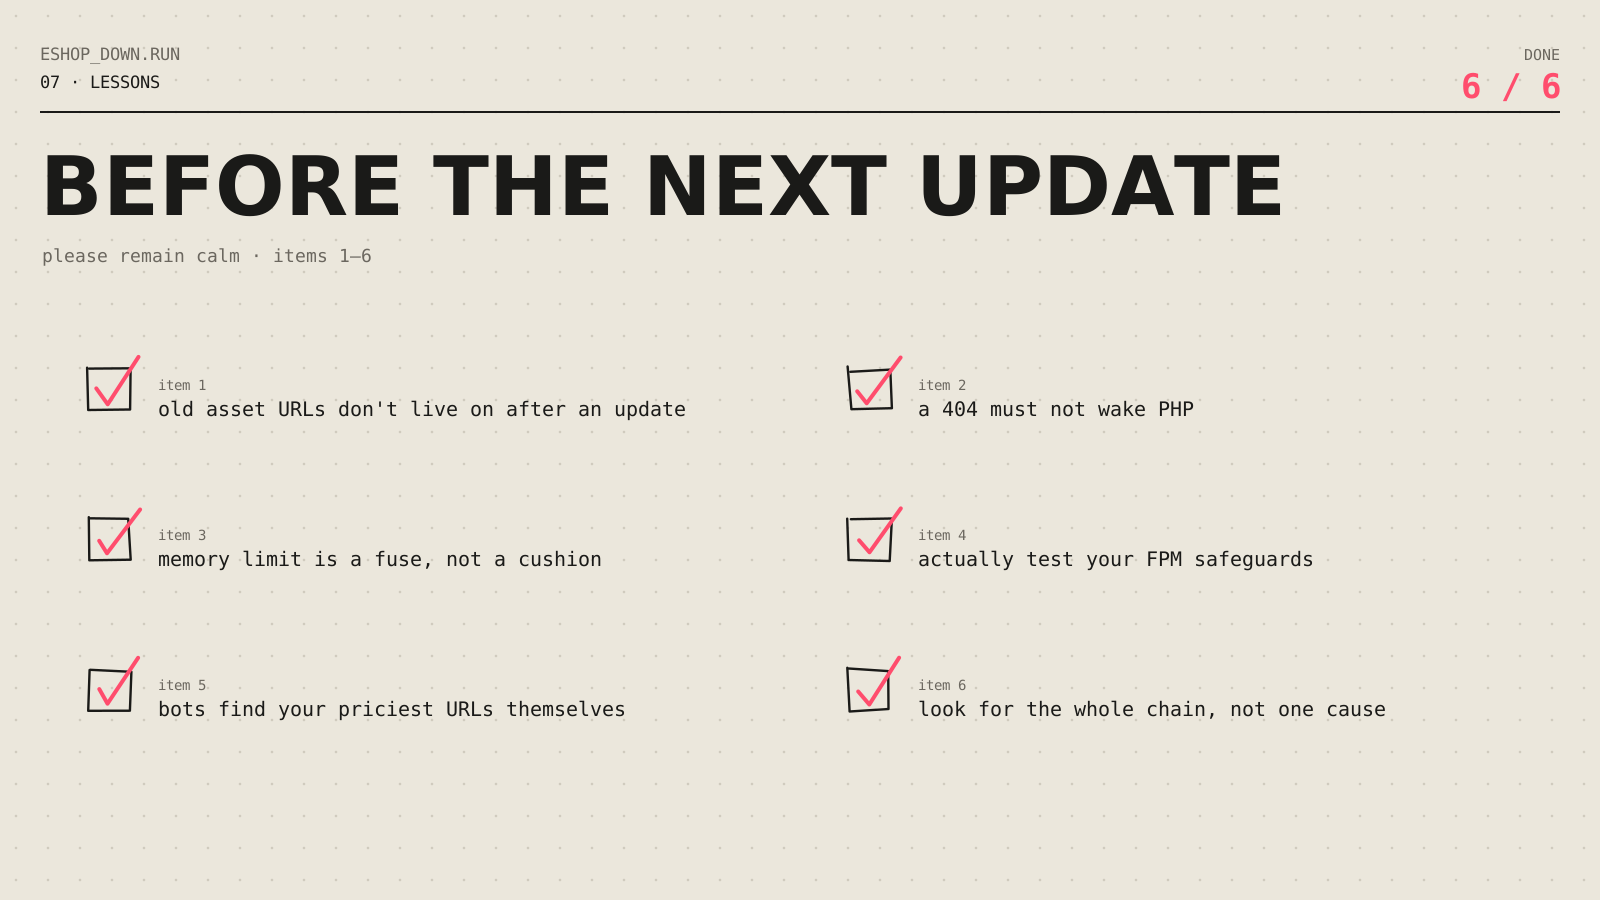
Checklist: what to check on your own site
- After a plugin update, check whether the old URLs of its files live on in a cache or in external links.
- A 404 must not be expensive. A non-existent static file should not wake PHP.
- The PHP memory limit is a fuse, not a cushion. A higher value is not a better one.
- Test that your PHP-FPM safeguards actually work. A directive in the wrong place does nothing and reports it nowhere.
- Bots will find your most expensive URLs on their own. Plan for that in your cache and your WAF.
- One cause will not take a site down; a chain will. Look for the whole chain.
Is your site going down while your hosting says everything is fine?
Get in touch. We will go through the logs and the server configuration and find where the chain comes together.